Is the market mispricing? Either gold or U.S. Treasuries is ‘lying.’

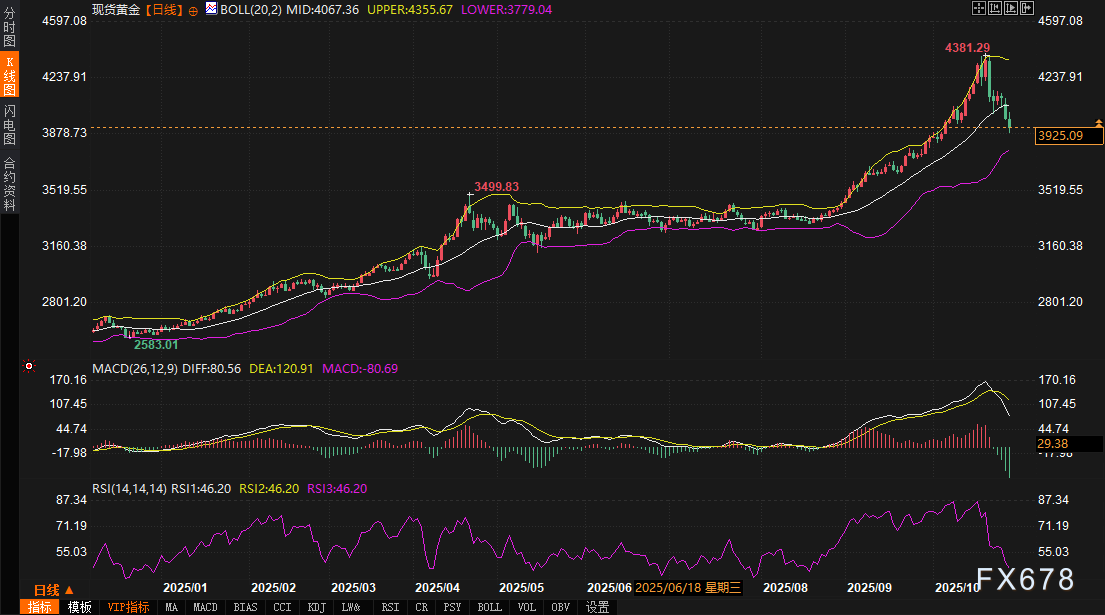
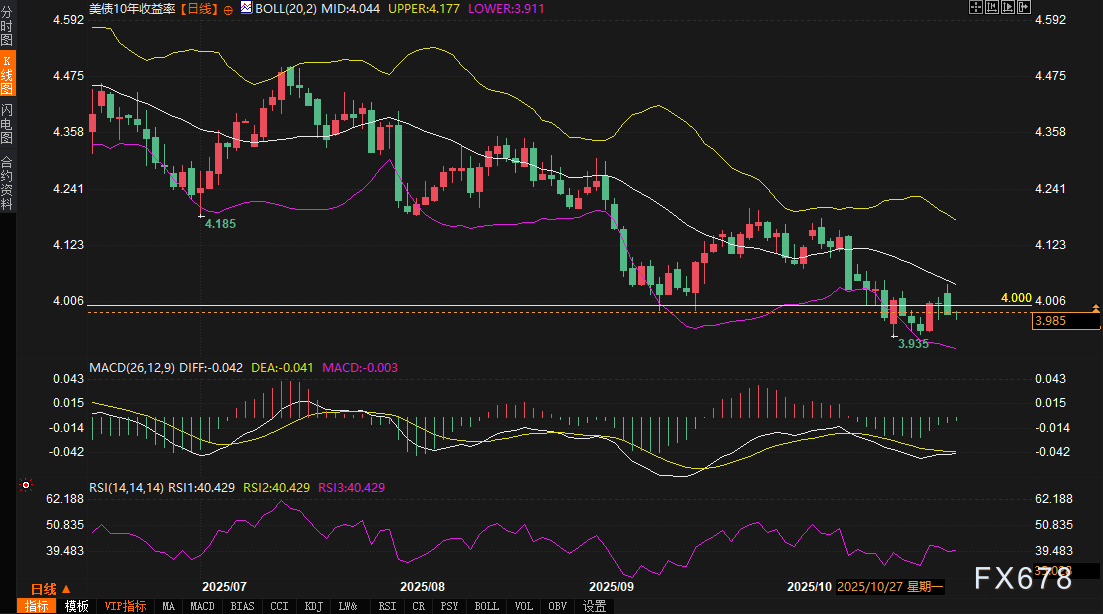
On Tuesday (October 28), spot gold extended its pullback, breaching the psychological threshold of $4,000, with a low of $3,886 per ounce before rebounding slightly to around $3,922. Since hitting an all-time high of $4,381.29 on October 20, the asset has plummeted over 10%. Heightened intraday volatility failed to reverse the downtrend. Meanwhile, the US Dollar Index hovered near 98.6880, trading in a narrow range between 98 and 99.5 recently, contrasting sharply with gold’s sharp decline and underscoring non-dollar factors as dominant drivers of current market dynamics. The yield on the 10-year US Treasury bond experienced roller-coaster-like fluctuations, briefly reclaiming the 4% level on Monday but quickly retreating to 3.985%, closing yesterday at 3.982%. This subtle shift reflects growing market caution ahead of the Fed’s FOMC meeting, with the appeal of Treasuries as a safe-haven asset resurfacing. Overall, at the start of this week, a combination of recovering risk appetite and policy expectations drove capital rotation between gold and Treasuries, setting the stage for potential tug-of-war action around key technical levels in the short term.
Fundamental Crosscurrents: Policy Expectations and Sudden Variables Drive Trends
The Federal Reserve’s policy trajectory remains the market anchor. Under the baseline scenario, the probability of a 25-basis-point rate cut at the October 28-29 FOMC meeting has climbed to 96%, alongside narrowing divisions in the September meeting minutes regarding an additional rate cut by the end of 2025. Market pricing now assigns near-100% probabilities for rate cuts in both October and December. Inflation data also provided support, with the October 24 CPI showing a month-on-month increase 0.2 percentage points below expectations, further enhancing the attractiveness of non-interest-bearing assets like gold while paving the way for a decline in Treasury yields. Slowing economic growth expectations—GDP forecasts revised down to 1.8%—reinforce this baseline, pushing yields toward the 3.9% range. Over the past week, the 10-year yield has gradually retreated from 4.02%, and although gold remains under pressure, it is still viewed as a structural long-term play in the medium term.
However, over the past 24 hours, sudden developments in newsflow have caused actual movements to deviate from expectations, with gold’s sharp decline being particularly pronounced. Prominent analysis indicates that high-level US-China talks held in Malaysia on October 27 to discuss trade cooperation were interpreted by markets as a temporary easing of tensions. This signal weakened safe-haven demand, prompting funds to swiftly pivot toward equities, driving Wall Street indices to new highs and pressuring gold beyond the anticipated 3% intraday drop. This variable conflicted with baseline geopolitical uncertainties (e.g., Middle East aftershocks), becoming a primary catalyst for accelerating gold’s correction. Profit-taking by investors further amplified the effect. On October 27 morning, COMEX gold futures opened down 0.4% and cumulatively fell over 2% during the day due to concentrated unwinding of record-high short-term speculative positions and net outflows exceeding $1 billion from ETFs over the past week. Post-Diwali seasonal demand declines in India, though secondary, compounded pressures. The overall oscillation in the US Dollar Index (up only 0.1% intraday) suggests that gold’s recent plunge was less correlated with the dollar index and more akin to a message-driven “flash crash” continuation.
 Fluctuations in Treasury yields adhered more closely to the baseline but were similarly exacerbated by divergent factors intensifying downward pressure. On October 27, the risk of a US government shutdown escalated as congressional negotiations broke down again, entering the fourth week. This triggered a “flight-to-safety” inflow into Treasuries, with investors concerned that fiscal uncertainty could drag Q4 GDP growth down by 0.5 percentage points, exceeding soft-landing assumptions and pushing yields down 2-3 basis points intraday. Although trade cooperation signals boosted equities and indirectly reduced inflationary upside risks—having a neutral impact on Treasuries—the shutdown remained the most significant disturbance over the past 24 hours. Regional economic data worsened further, with the Philadelphia Fed Manufacturing Index plunging to -12.8 on October 27, far below expectations of +9.5, as employment and new orders subcomponents declined, reinforcing recession fears. Though not a national indicator, it amplified expectations for Fed rate cuts, briefly sending yields to a low of 3.97%. Liquidity-wise, notable reports showed overnight trading volumes in the 10-year Treasury below average, narrowing the yield spread to 1.5 basis points, with yields briefly returning above 4% early in the session but quickly retreating amid firm GC repo rates (opening at 4.35%), reflecting liquidity drainage (outflows triggered by $26 billion settlements on the first day of the week). While the Fed’s repo facility provided backing (yesterday financing $8.4 billion), markets remain cautious ahead of the FOMC outcome, with yields likely to continue testing the 4% threshold.
Expectations of the end of Quantitative Tightening (QT) have subtly permeated fundamentals. Institutional views suggest QT termination is not an immediate event, but once initiated, it will bring hundreds of billions in annual reinvestment, predominantly targeting 10-year-plus duration Treasuries. This would significantly absorb long-end supply and compress term premiums. The Fed’s balance sheet currently stabilizes at $6.5 trillion, with MBS maturing proceeds potentially redirected to pure Treasury reinvestment, further supporting a downward yield curve. By contrast, gold’s safe-haven narrative temporarily dimmed after trade tensions eased, but the Fed’s dovish tone continues to provide bottom-line support.
Technical Indicators: Convergence and Oversold Conditions Suggest Turning Points
From a technical perspective, the daily chart of spot gold shows a clear retracement channel since the October 20 high of $4,381.29, with Bollinger Bands narrowing, signaling contracting volatility and potentially brewing a directional breakout. The MACD indicator currently shows the DIFF line at 80.46 and the DEA line at 120.88, with their negative divergence intensifying bearish momentum. However, the RSI has dropped to 46.08, entering neutral territory and nearing oversold thresholds. Combined with the intraday rebound from the $3,886 low, gold may stabilize before the FOMC. The narrow consolidation of the US Dollar Index (within the 98-99.5 range) further confirms that gold’s movement has gained independence, no longer dominated by traditional inverse correlations.
The technical chart of the 10-year US Treasury yield appears more stable, briefly breaking through 4% in early trading on Monday (after closing at 3.982% yesterday and briefly spiking higher), but quickly retreating to 3.985%, forming a small head-and-shoulders top pattern on the daily chart with the neckline near 3.97%. The pullback from 4.02% over the past week aligns with the downward channel, with the RSI neutral-to-weak and the middle Bollinger Band providing support. If liquidity drainage persists (cumulatively exceeding $50 billion over three days this week), yields may test the low of 3.95%, but the 4% level acts as a psychological anchor, likely triggering heightened volatility between bulls and bears. Prominent institutions have assessed tactical positioning as favoring ‘liquidation preference,’ suggesting attention to narrow-range trading in the 10-year yield between 3.99% and 3.96%; the FOMC outcome could break the current deadlock.
Notably, details of US Treasury liquidity reinforce technical signals: GC repo rates opened 2 basis points higher at 4.35%, above the 10-day average of 4.29% and surpassing the upper bound of the interest rate corridor (4.25%) by 10 basis points. Demand for yesterday’s RRP operations rose to $10.6 billion (from $2.4 billion the previous day), signaling tight liquidity conditions. The current repo rate curve shows a premium demand of 55 basis points for 5-year maturities, while the 20-year segment remains steady at 14 basis points, indicating rising attractiveness for long-dated Treasuries. This mirrors the oversold signal in gold, with capital potentially rotating between the two; short-term volatility may increase due to a data-heavy week.
Short-Term Outlook: Tug-of-War Before the FOMC and Potential Turning Points
Looking ahead over the next 2-3 days, US Treasury yields may continue to trade narrowly around the 4% level, supported by the downward channel baseline, which could lead to testing the 3.95% support level. However, expectations of QT reinvestment and positive spillover from trade cooperation signals might limit downside risks. If the October 29 PPI data meets expectations (indicating further cooling of inflation) and incorporates Congressional developments, the yield midpoint may stabilize between 3.98% and 4.00%. Spot gold faces a more severe test, with downward momentum yet to be exhausted, but technical oversold conditions and confirmation of Fed rate cuts will provide a rebound window. Gold is expected to consolidate within the $3,900-$4,000 range. An unexpectedly dovish FOMC statement (e.g., hinting at an accelerated pace of rate cuts in 2025) could push prices back above $3,950. Conversely, continued weakness in regional data or intensified safe-haven rotation could indirectly benefit gold stabilization as Treasury yields decline.
This week’s data calendar is packed; on Tuesday (October 29), the Case-Shiller and FHFA Housing Price Indices will be released (expected to decline 0.1% month-on-month and slow to 1.3% year-on-year), alongside the Consumer Confidence Index (projected to drop to 93.2), Richmond Fed and Dallas Fed regional surveys, and a $44 billion auction of 7-year Treasuries. Should these indicators reflect weakening housing prices and consumer confidence, recession pricing would strengthen, pushing yields lower while injecting new fuel into gold’s safe-haven narrative. Liquidity drainage effects may peak midweek, amplifying volatility, though the buffering role of the Fed’s repo facility should not be overlooked. Overall, market pricing has become ‘pristine,’ and the FOMC outcome will act as a watershed moment, potentially reshaping the correlation between gold and Treasuries post-policy announcement. Traders should remain vigilant against amplified effects from unexpected news developments.