Natco Pharma’s Technical Indicators Reflect Mixed Sentiment Amid Market Volatility
Natco Pharma, a small-cap player in the Pharmaceuticals and Biotechnology sector, has recently undergone an evaluation revision reflecting its current market dynamics. The stock is currently priced at 884.30, showing a notable increase from the previous close of 857.50. Over the past year, Natco Pharma has experienced significant volatility, with a 52-week high of 1,583.85 and a low of 660.05.
In terms of technical indicators, the weekly MACD and moving averages suggest a bearish sentiment, while the monthly RSI indicates a bullish trend. The Bollinger Bands and KST metrics are categorized as mildly bearish on both weekly and monthly scales. The On-Balance Volume (OBV) shows a mildly bullish trend on a weekly basis, contrasting with the monthly bullish outlook.
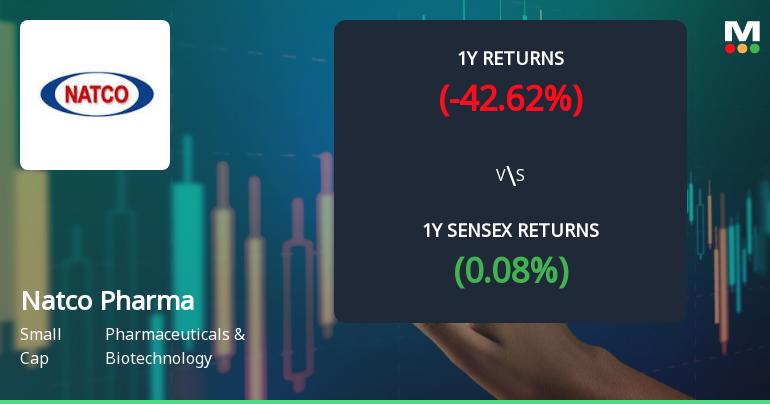
When comparing the stock’s performance to the Sensex, Natco Pharma has shown varied returns. Over the past week, it outperformed the Sensex with a return of 4.07% compared to the index’s 1.80%. However, year-to-date, the stock has underperformed significantly, with a return of -36.24% against the Sensex’s 6.24%. Notably, over a three-year period, Natco Pharma has managed a return of 44.59%, surpassing the Sensex’s 41.08%. This evaluation adjustment highlights the company’s fluctuating performance amidst broader market trends.
Credit: Source link