Your Active ETF Is Cheap, But Your Trade Might Not Be
Investors have been flocking to active exchange-traded funds for fees that often undercut the cheapest mutual fund share classes, but expense ratios are only the sticker price. The full cost of ownership includes what you pay to trade, such as the bid-ask spread.
The spread is the gap between what buyers pay, or the ask, and what sellers receive, or the bid. Mutual fund investors never face this; they transact once a day at net asset value. But ETF investors pay spreads every time they trade. These costs can eat into returns of frequent traders or rebalancers, but long-term holders should prefer tight spreads, too.
What a Spread Buys
Spreads are the price of liquidity. Market makers earn them by standing between buyers and sellers, quoting prices, holding inventory, and standing ready to trade. The spread pays for three things:
- Inventory risk. Holding ETFs or their underlying assets exposes market makers to price swings. The more volatile or illiquid the holdings, the greater the risk—and the wider the spread.
- Basket trading costs. Creating or redeeming ETF shares requires buying or selling the underlying assets. Brokerage fees, spreads on the securities in the basket, and operational costs all show up in the ETF’s own spread.
- Profit margin. Like any business, market makers expect to earn more than they spend.
Spreads Reflect the Basket—and the Buzz
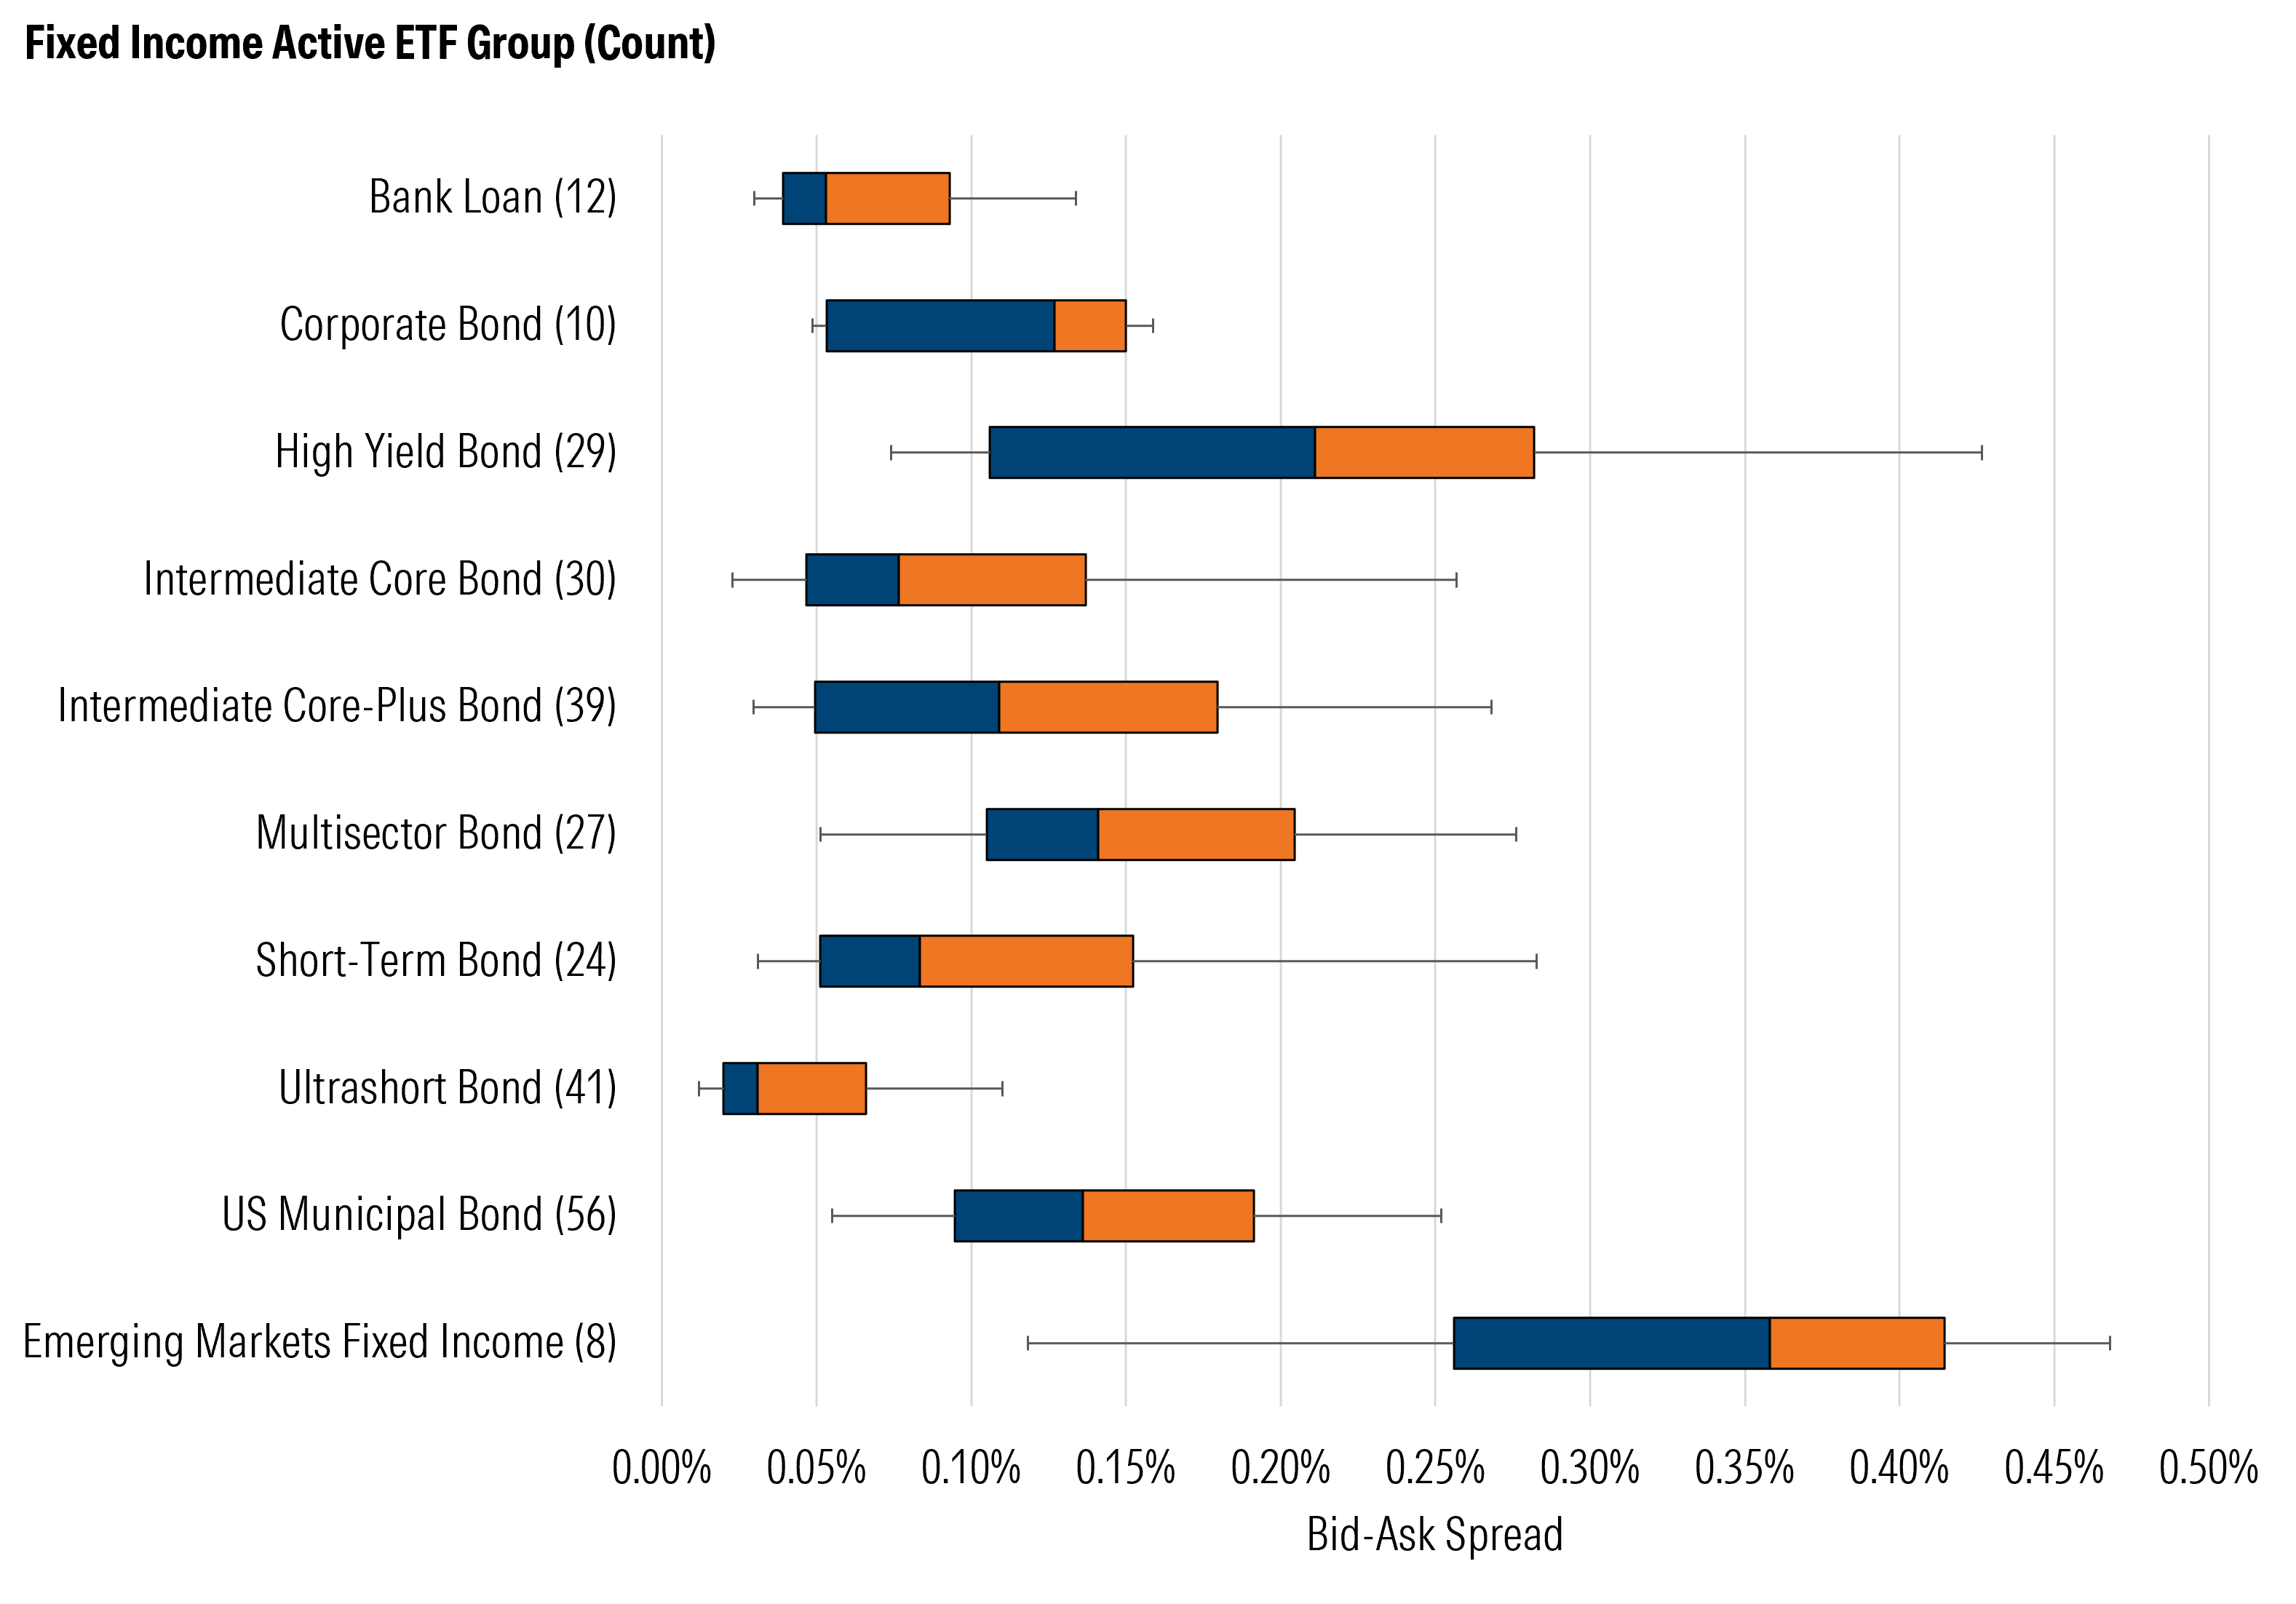
Some baskets are easy for market makers to assemble, such as large-cap US stocks and Treasuries. Others are much costlier, such as thinly traded micro-cap stocks, obscure bonds, or emerging-market assets. That helps explain why, as of Sept. 19, 2025, the 0.12% median spread for US large-cap stock active ETFs was tighter than small-cap active ETFs’ 0.20%, while the typical emerging-market equity fund’s spread was double that of large-cap ETFs’. (These figures are percentages of ETF prices.)
Frequently traded ETFs tend to trade cheaply. High volume is a magnet for market makers: It signals active interest, enables rapid inventory turnover, and reduces the risk of holding positions. When market makers can offload exposure quickly, they don’t need to price in as much risk. Volume fuels competition. The more an ETF trades, the more market makers are willing to quote prices in it, narrowing spreads.
When Spreads Jump
Bid-ask spreads are tightest when markets are calm and security pricing is straightforward. But when volatility strikes, market makers widen them to cover greater risk. Big news like Fed announcements, economic data releases, or geopolitical shocks can also blow spreads open.
Inventory risks can increase. If a market maker buys shares and prices drop before they can sell, they’re left holding the loss. In volatile markets, the chances of that happening rise. Hedging, typically done through the ETF’s underlying securities or correlated instruments, also becomes more costly, compounding the challenge.
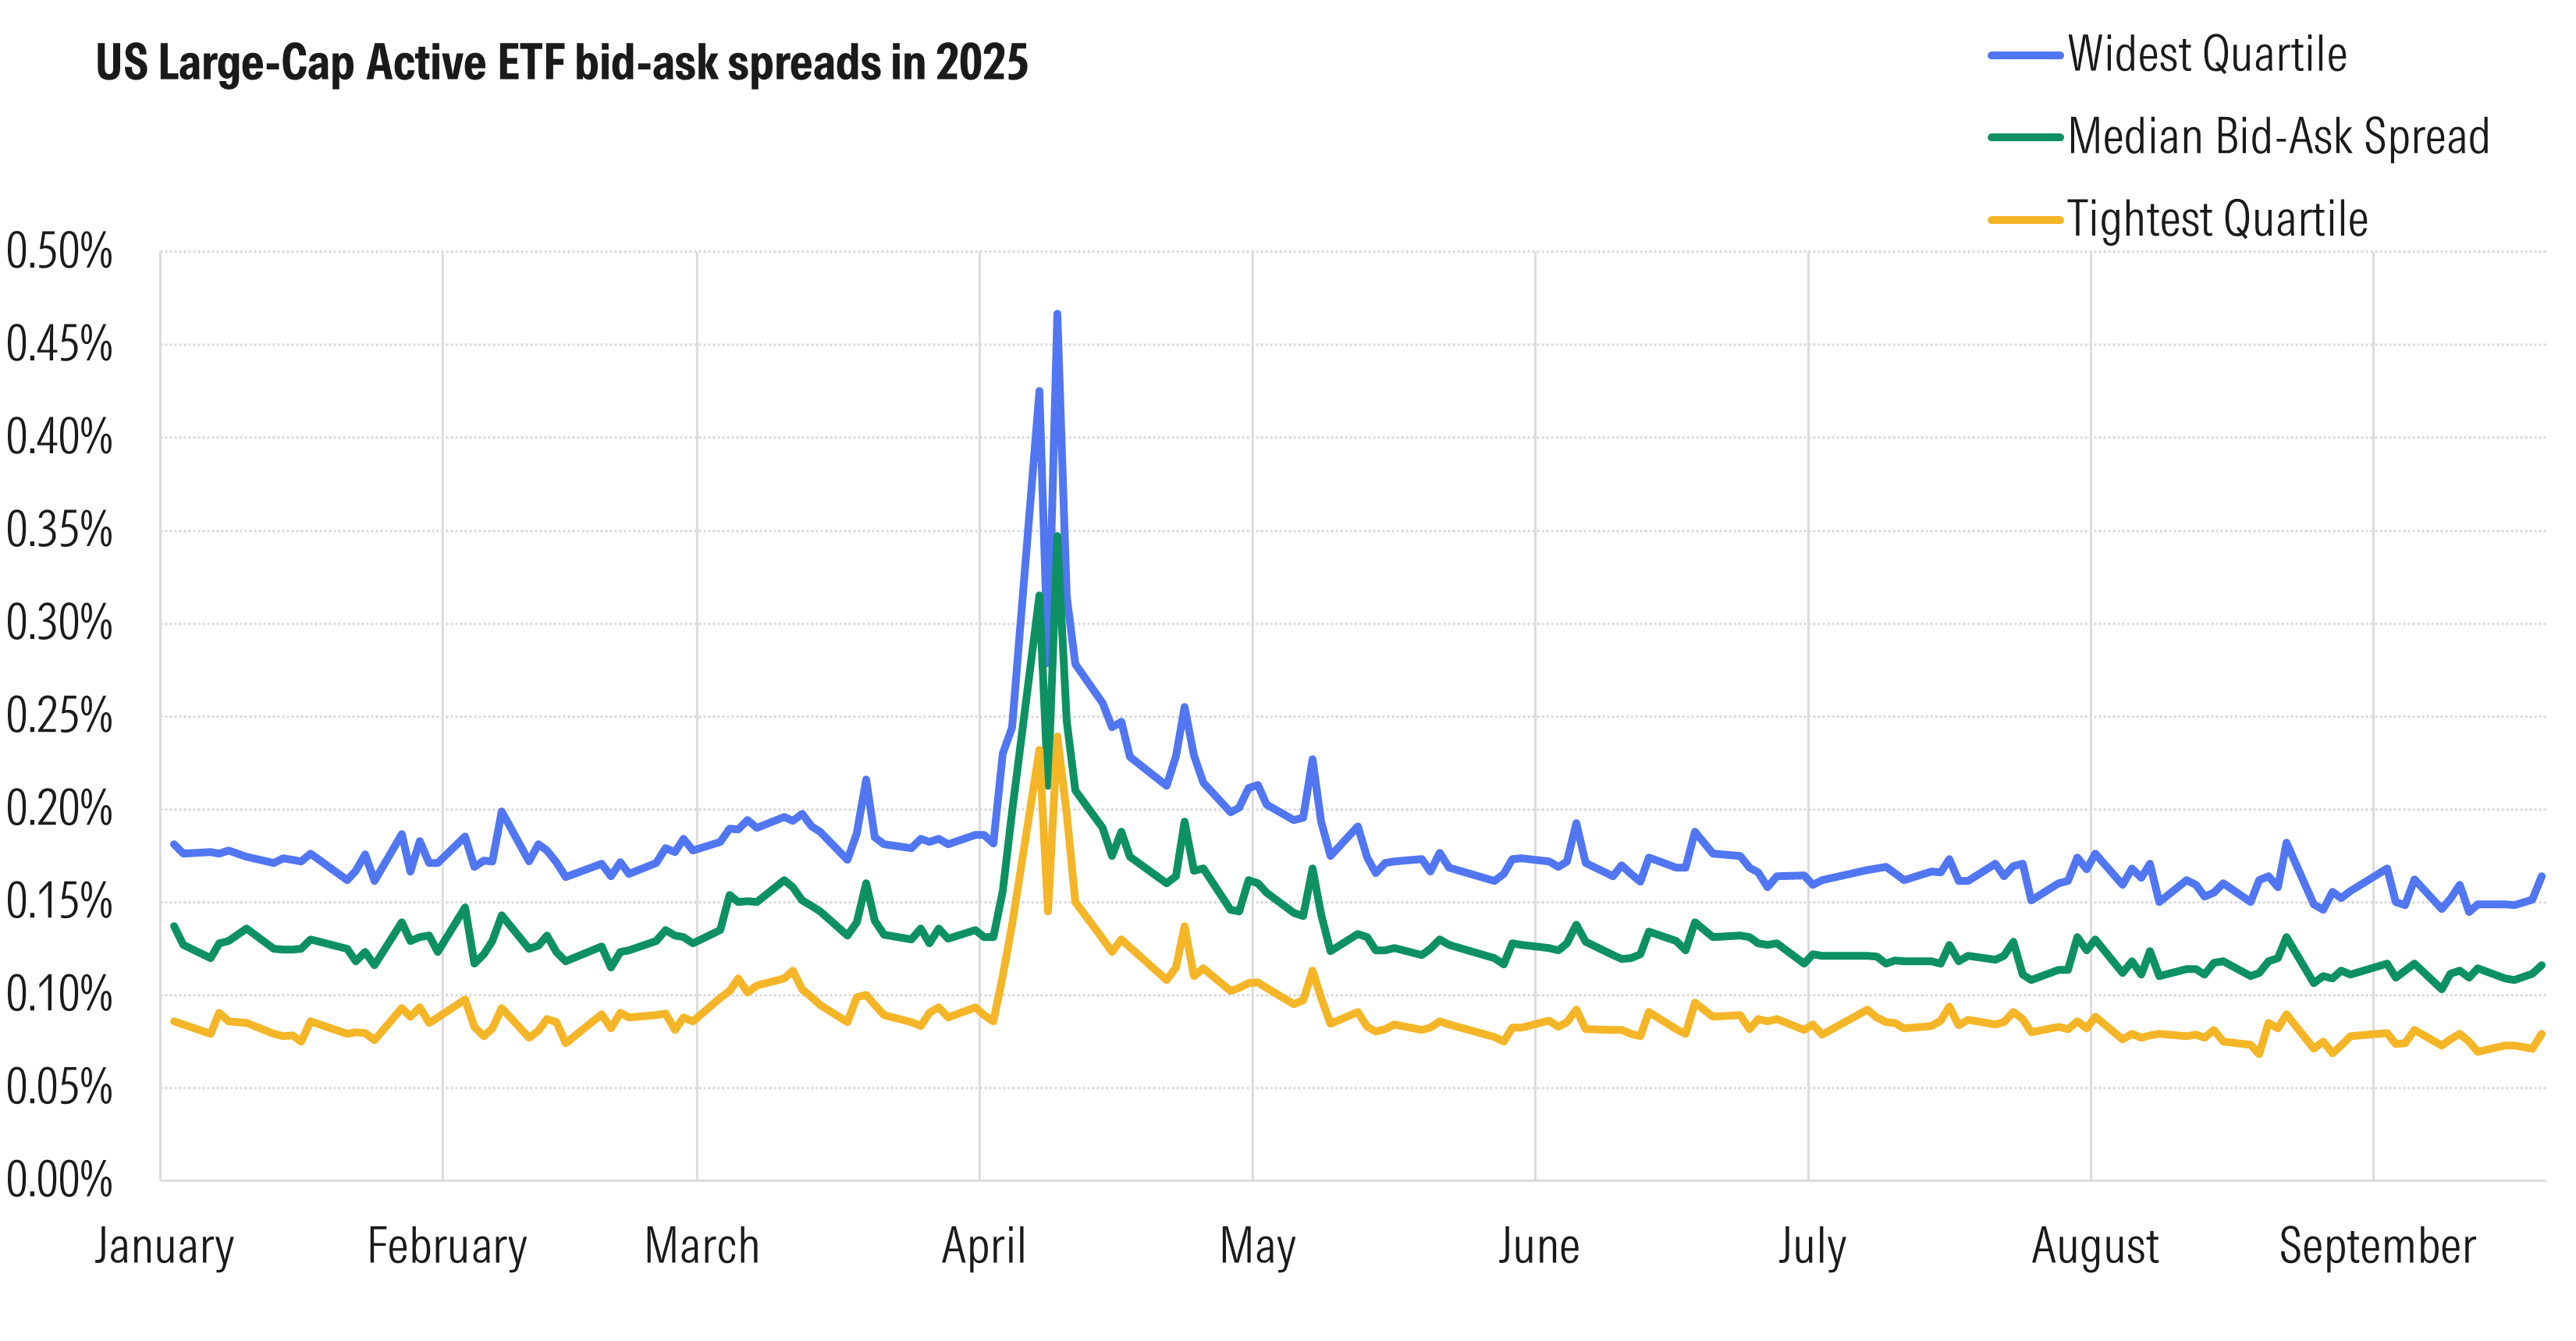
For example, as the S&P 500 plunged 10% in early April 2025 following newly announced tariffs on America’s trading partners, the spread for a typical large-cap active ETF more than doubled to roughly 0.35%. The typical spread for emerging-market active ETFs spiked to around 0.75% before retreating to its normal range of 0.20% to 0.40%.
Spreads also often widen near the market’s open and close. At the open, not all an ETF’s underlying securities may have begun trading, forcing market makers to price with incomplete information. To compensate, they widen spreads. Near the close, many step back to reduce risk overnight, thinning liquidity and driving spreads wider again. Spreads are often narrower midsession.
The same logic applies to ETFs investing in local-market foreign stocks or bonds when the underlying markets are closed. Without live prices, market makers must rely on stale prices or proxies, which adds guesswork—and spread.
How to Shop—and Trade—Smart
1) Check the spread before you buy.
When shopping for an active ETF, compare its bid-ask spread to its Morningstar Category peers using recent data. Every ETF’s website displays its trailing 30-day median bid-ask spread in menus labeled “Fund Details,” “Prices,” or “Trading Data.” Be wary of ETFs that neglect this disclosure.
2) Use limit orders. Always.
A limit order caps what you will pay (or accept), protecting you from paying a temporarily wide spread. By setting a limit, you guarantee the transaction will only occur at or better than your specified price, guarding against paying a wide, unfavorable spread.
3) Mind the clock and calendar.
Avoid the first 30 minutes after the open and the last 30 minutes before the close, when many securities haven’t fully “woken up” or liquidity providers are trimming risk. Avoid bouts of market volatility when spreads often widen.
4) Know when foreign markets are closed.
If you’re trading an ETF that owns non-US stocks or bonds, spreads tend to widen when those markets are shut. You’re paying for guesswork; if possible, trade when home markets are open.
5) Prefer sponsors that run tight markets.
Issuer strength shows up in trading quality. A solid track record of below category median spreads across their active ETFs is often a sign that firms have the robust market maker relationships and active capital-markets support to deliver tight spreads.
The Bottom Line
Active ETF fees are often cheaper than mutual funds, but your all-in cost includes trading frictions. Be mindful of the spread, which reflects what you’re paying for the convenience of intraday liquidity. Favor funds with liquid holdings, healthy scale, and attentive sponsors. Use limit orders. Time your trades. A handful of good habits can quietly boost your portfolio’s performance over the long haul. For additional guidance on selecting strong funds, see Morningstar’s new Guide to Active ETF Due Diligence.
Credit: Source link